| Overview | Hardware | Software | Appendix | Home |
|
|
SoftwareAs I realised early on that any form of exact speed measurement was not going to be possible with a just an accelerometer and ATtiny13, I set about investigating other methods that might work. As the RAM and program space on the tiny13 are rather limited for any data intensive operation I needed a way of looking at the last 5 – 10 seconds of data (around 300 bytes) without actually keeping it in memory. What I needed was a filter that would take all the information from the accelerometer and reduce it to a 1-bit value representing whether or not the train was moving. Using a data logger and accelerometer I recorded the acceleration of my daily commute. I then wrote prototype filters in standard C to run on the data obtained. These would run on my computer and I could analyse the results. Figure 2 below shows the output of one such filter. The command line C program takes X, Y and Z values and then evaluates the data and counts the stops. Once a working filter was obtained through trial and error it was then implemented on the AVR in assembly language.
The filter works as follows: the data from the three axes are combined to give a magnitude of the acceleration during the movement of the train this is a slightly noisy signal. The difference between the current and previous magnitude is examined and if it is considered below a low noise threshold then a counter is incremented. When this counter reaches a top value the total number of samples needed to reach this top value is used as a metric to determine how noisy the signal is. If the signal is considered low noise then a low noise counter is incremented. This is the middle graph in Figure 2 above. This low-noise counter is used to introduce some hysteresis between the still and moving states. If the low-noise count reaches zero then the train is recognised to be moving and if the low-noise count reaches a top limit then the filter considers the train to be stopped. This rather complicated system was employed to minimise the amount of memory and 16-bit arithmetic required. The bottom graph in Figure 2 shows the acceleration magnitude for each sample in red with the green sections displaying the when the filter considered the train to be stopped. The top graph simply shows the running count of stations. The technique of developing code using standard C on a computer rather than a standard code, burn and JTAG process was found to be very effective. This technique was used as I have no debug-wire capable tools and it would not have been very practical to debug on a crowded commuter train if I had. |
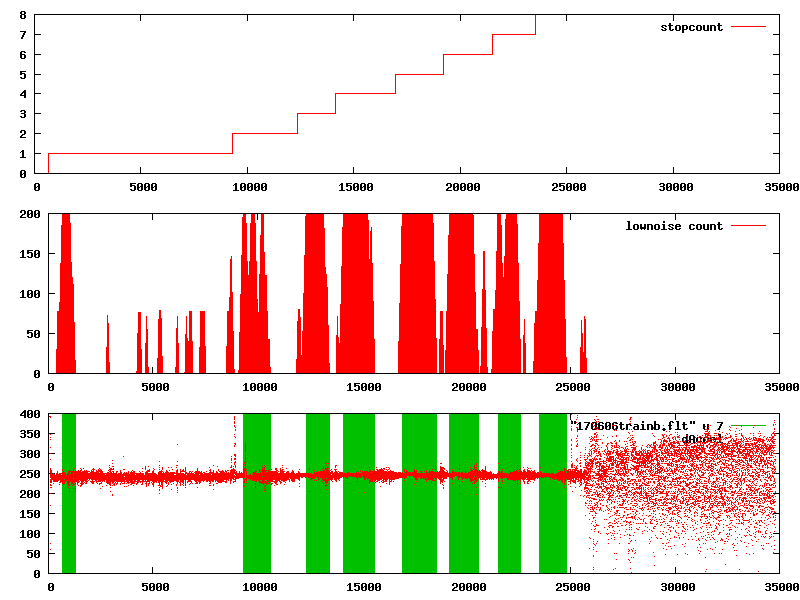 Figure 2 Graphical output from the prototype filter on the PC.
| Overview | Hardware | Software | Appendix | My Blog |