Moving code from Arduino to Raspberry Pi

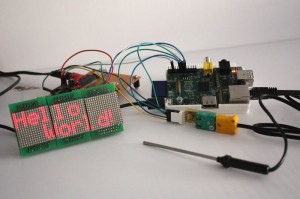
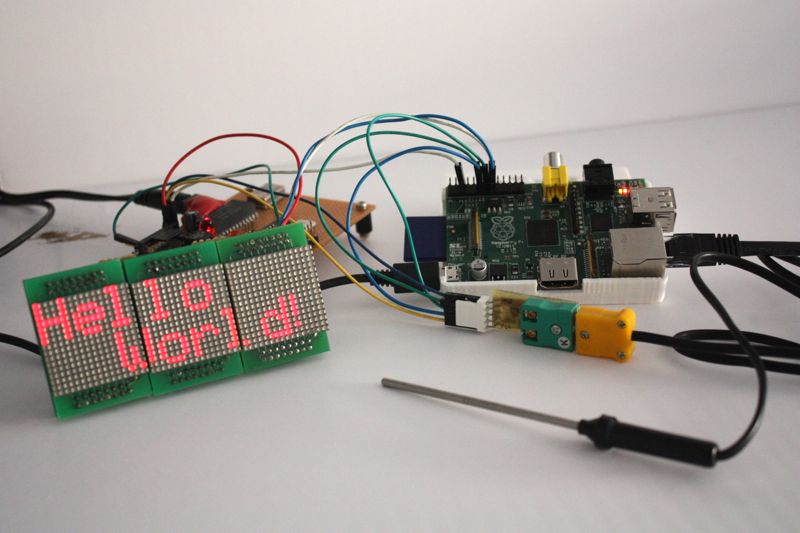
Photo: Hello world, using the wiringPi library to control an LED display.
Photo: Hello world, using the WiringPi library to control an LED display.
Photo 1: Hello world, using the WiringPi library to control an LED display.

To celebrate getting the GPIO working using WiringPi from Gordon Henderson I thought I’d have a quick look at the difference between running some code on an Arduino compared to running almost the same code on a Raspberry Pi (RasPi).

It is worth noting now that the setups I’ve been using to test with are all powered from a separate 3.3V supply with the grounds linked. Nothing is being powered via the RasPi itself to avoid drawing too much current should I make a mistake. When working with the RasPi you should be careful as the RasPi will not take kindly to static discharge, connecting things backwards or the wrong voltage levels.

The really great thing about Gordon’s library is that by using it I am able to transfer Arduino code to the RasPi with only a few simple changes. Obviously not everything in the Arduino libraries are present, but the basic I/O manipulation is plenty for some simple applications.

MAX6675 thermocouple interface example

The MAX6675 from Maxim is an SPI Bus based thermocouple convertor that I built a breakout board for a while back. You can find out more information about that project in this earlier post.

As a simple test I took the basic example from the MAX6675 thermocouple interface library and adapted it to run with the WiringPi library on the RasPi.

I initially ported the example and library to C as the WiringPi was in C and I had a couple of issues compiling mixed C and C++ properly. After a bit of investigation I found that when explicitly including the libraries as C the compiling problems go away. Below is an example of how to modify the wiringPi.h file to ensure it is included as C and not C++. Gordon has said he will make this change to the library on the next release. Once I had sorted out the makefile to use g++ rather than gcc I was able to compile and link successfully.

Listing 1: Explicitly declaring a header file as C


 #ifdef __cplusplus
 extern "C" {
 #endif
  
 // wiringPi.h Code goes Here 
 //  or 
 // #include <wiringPi.h>

 #ifdef __cplusplus
 }
 #endif

While compiling and linking of the example was now okay, the next problem was that when run, the program just exited with a “Segmentation Fault” (segfault). I didn’t even see the error message when running as root with sudo, it was only when running as the standard user (pi) that it became apparent that something was wrong with the software rather than the hardware.

When I had run previous examples as the standard user I would see a permissions related error complaining that the program could not access the “/dev/mem/” device. This error comes from the part of the WiringPi library that sets up memory access to the hardware registers in the Broadcom BCM2835. This clue told me that the wiringPiSetup routine was not being run. This in turn showed me that the global object representing the temperature sensor was being constructed before the WiringPi library was being setup.

The solution to this particular problem was simple enough. I edited the MAX6675 library so that it calls wiringPiSetup directly when initialising. I also set an internal flag if this succeeds. In addition to this I modified the methods to exit with an error if the flag has not been set. This means that none of the MAX6675 library methods should ever call WiringPi functions without the appropriate initialisation having taken place and succeeded beforehand. My code for this example is here. A more general solution might be to add this flag to the WiringPi library itself.

LED Display (MLMC) and Temperature Combined Example

Following my success with the temperature sensor I decided to push the boat out a little further and try to interface to my MLMC LED display system.

The MLMC LED display is a set of LED dot matrix control PCBs I designed to use up some unusual LED modules I had lying about. You can get the full story in this blog post or on the website.
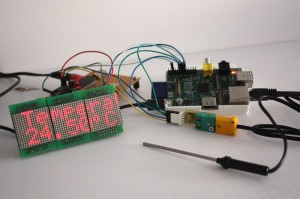
Photo:  Using the WiringPi library to control an LED display and Thermocouple interface
Photo 2: Using the WiringPi library to control an LED display and thermocouple interface

This was a simple demonstration with the RasPi reading from the thermocouple interface and then displaying the temperature on the display. For this example I wrote everything in C. The MLMC interface is very simple and involves clocking 16 bit words of data using two pins, one for data and one for clock. Each word represents a single column on the LED display. This low speed (~5Kbps) synchronous protocol was originally implemented by directly manipulating the digital I/O pins on the Arduino and so was very simple to port to the RasPi with the WiringPi library.

While the ported program functions very well, the waveforms obtained from the RasPi are quite different to those achieved with the Arduino. This is a good example of how the same simple code can be quite different when ported between platforms.

MLMC Clock Waveforms

The function used to send serial data to the MLMC is shown below. This code has a 75µs delay between switching the level of the clock and this gave uniform pulses on both systems. The pulses also appeared consistent from one run to another.

Listing 2: MLMC serial data sending routine


const int spidelay_us =75;

void Send_byte( char data ///< 8 bit data to be sent
			   ) {
    uint8_t temp;	// local copy of the data to be shifted out
    uint8_t i;					
	
    temp = data;	
    for (i=0; i<8; i++) {
		// start the cycle with the clock pin low
        digitalWrite(clockPin, LOW);

		// clock out a single byte
        if (temp & (1<<7)) {
            digitalWrite(dataPin, HIGH);
        } else {
            digitalWrite(dataPin, LOW);
        }
        
		// wait for data bit to be set up
		delayMicroseconds(spidelay_us);
        
		// clock the data out by producing a rising edge
        digitalWrite(clockPin,HIGH); 
		
		// wait for mlmc to read the data bit in 
        delayMicroseconds(spidelay_us);
		
        // shift data along by one
        temp <<= 1;
    }
	
	// leave both pins low when idle 
    digitalWrite(clockPin, LOW);
    digitalWrite(dataPin, LOW);
}

The following scope traces are the result of executing Listing 2 on the Arduino:
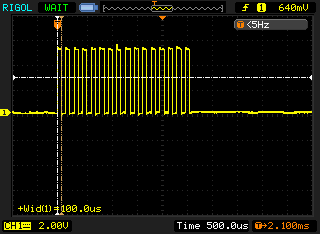
Clock pulses from the Arduino to the MLMC modules
Figure 1: Clock pulses from the Arduino to the MLMC modules
Single clock pulse from the Arduino to the MLMC modules
Figure 2: Single clock pulse from the Arduino to the MLMC modules

Arduino has a total pulse time of approximately 80µs for the first clock pulse to MLMC. This extra 5µs I assign to the time taken to call the digitalWrite function, a single shift operation and iterating the for-loop.

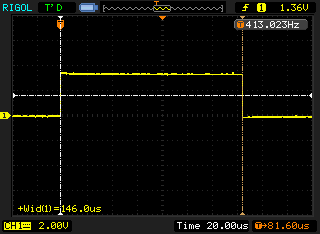
The next two traces in figure 3 and figure 4 are produced when running the same code on the RasPi:
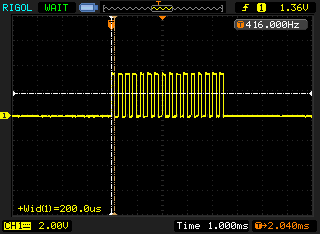
Clock pulses from the Raspberry Pi to the MLMC modules
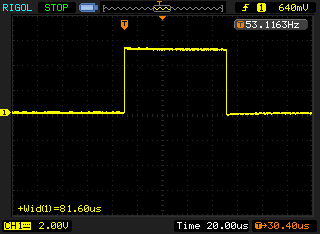
Figure 3: Clock pulses from the Raspberry Pi to the MLMC modules
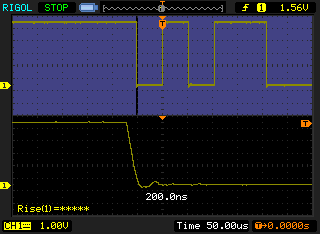
Single clock pulse from the Raspberry Pi to the MLMC modules
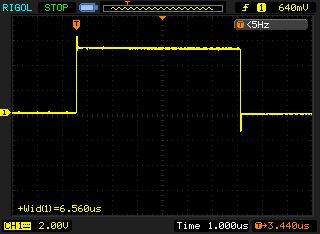
Figure 4: Single clock pulse from the Raspberry Pi to the MLMC modules

You can notice that while the pulses look identical at a quick glance the RasPi has 150µs pulse width; almost double that of the Arduino. I assume that the delayMicroseconds function, which only guarantees that a minimum of the given microseconds have elapsed before returning, is releasing control to the operating system and coming back a lot later than expected. As the delay implementation in the WiringPi library simply calls nanosleep I am surprised this operation takes twice as long. There may be a number of causes for this behaviour:

  • There might be a bug in the way the delay function is implemented.
  • The shift and for-loop iteration might have compiled in a very inefficient way.
  • The operating system simply cannot schedule other tasks quickly enough to return from nanosleep and meet our expectations.

MAX6675 thermocouple interface

This loop was clocking data in from the MAX6675 chip via a “bit-banged” interface. The main loop did not have a delay and was toggling bits as quickly as possible while shifting in the value via a single GPIO pin.

Listing 3: SPI send section from the MAX6675 library


digitalWrite(_CS_pin,LOW); // Enable device

/* Cycle the clock for dummy bit 15 */
digitalWrite(_SCK_pin,HIGH);
digitalWrite(_SCK_pin,LOW);

/* Read bits 14-3 from MAX6675 for the Temp 
 Loop for each bit reading the value and 
 storing the final value in 'temp' 
 */
for (int bit=11; bit>=0; bit--){
	digitalWrite(_SCK_pin,HIGH);  // Set Clock to HIGH
	value += digitalRead(_SO_pin) << bit;  // Read data and add it to our variable
	digitalWrite(_SCK_pin,LOW);  // Set Clock to LOW
}

/* Read the TC Input inp to check for TC Errors */
digitalWrite(_SCK_pin,HIGH); // Set Clock to HIGH
error_tc = digitalRead(_SO_pin); // Read data

digitalWrite(_SCK_pin,LOW);  // Set Clock to LOW
digitalWrite(_CS_pin, HIGH); // Disable Device

The following traces in figure 5 and figure 6 show the results on the Arduino.
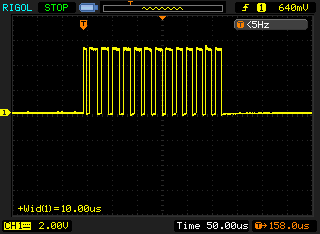
Clock pulses from the Arduino to the MAX6675 modules
Figure 5: Clock pulses from the Arduino to the MAX6675
Single clock pulse from the Arduino to the MAX6675 modules
Figure 6: Single clock pulse from the Arduino to the MAX6675

On the Arduino this code gave a uniform pulse train with the pulse widths measuring approximately 6-7µs. As the Arduino is running at 16Mhz I would like to think this could be optimised a lot more to get something like 120ns if I used some assembly or bypassed the Wiring/Arduino API, but that is an exercise for another blog post. 🙂
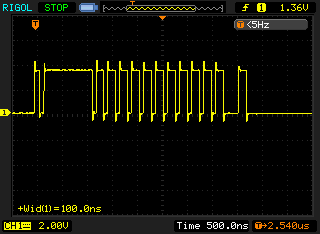
Clock pulses from the Raspberry Pi to the MAX6675 modules
Figure 7: Clock pulses from the Raspberry Pi to the MAX6675
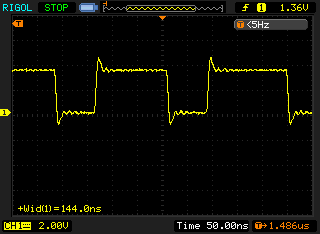
Close-up clock pulses from the Raspberry Pi to the MAX6675 modules
Figure 8: Close-up clock pulses from the Raspberry Pi to the MAX6675

The RasPi on the other hand gave a very non-uniform pulse train. As this is synchronous communication, the clock does not need to be uniform, it dictates when the data line is read. The average pulse in this waveform is only 150ns wide which is approximately 48 times faster than the Arduino. Given that the RasPi clock speed of 700MHz is roughly 44 times faster then the Arduino clock speed of 16MHz, this makes sense.

The RasPi would vary any individual pulse length by up to a factor of two (from observation) but did not seem to be effected by increasing the load (multiple ssh sessions and running an openssl speed test). The RasPi would also continue to run the MLMC scrolling display and reading the temperature sensor without issues while another process was also reading the temperature sensor at the same time (single_temp.cpp from first example above). Even while openssl was doing speed testing (cpu usage at 98-99%) the visible operation of the screen was not effected.

Investigating Further

The long delay and changing pulse widths could be investigated further with a couple of short programs.

I could investigate the long delay further by looking at repeating the test with the system under different loads and noting the effect on the width and consistency of the pulses. To vary the workload on the RasPi I could use a tool like stress.

We could also step through many values while keeping the system load constant. This would give us an idea if their was a minimum overhead experienced by the delay function or if their was some sort of error in the calibration.

I will leave these as an exercise for another day as plenty of work has already been done on this sort thing before, although not specifically on the RasPi.

Conclusions

This was a very quick look into porting code from Arduino to Raspberry Pi. I found that it was not so difficult to port some very simple applications, the majority of the code would simply run unchanged.

While the code may compile and run, the actual operation of the code will always need to be checked carefully for timing issues and other unexpected behaviour when switching hardware and using new library implementations.

As these systems were using synchronous serial communication the exact shape of the waveforms did not actually need to be uniform for the system to work.

On review of the MAX6675 data sheet the timings slighty exceed the stated maximum clock freq of 4.3Mhz. So If I was intending to use this further I would introduce a short delay into the MAX6675 clock routine to ensure it complies with the data sheet.

The MLMC module operates perfectly with the timings achieved but we are operating at half the throughput we expected due to the delay function not operating identically to the same function on the Arduino. While this didn’t cause a problem in this simple test it could easily have done so in a slightly more complicated system.
The Raspberry Pi has arrived!

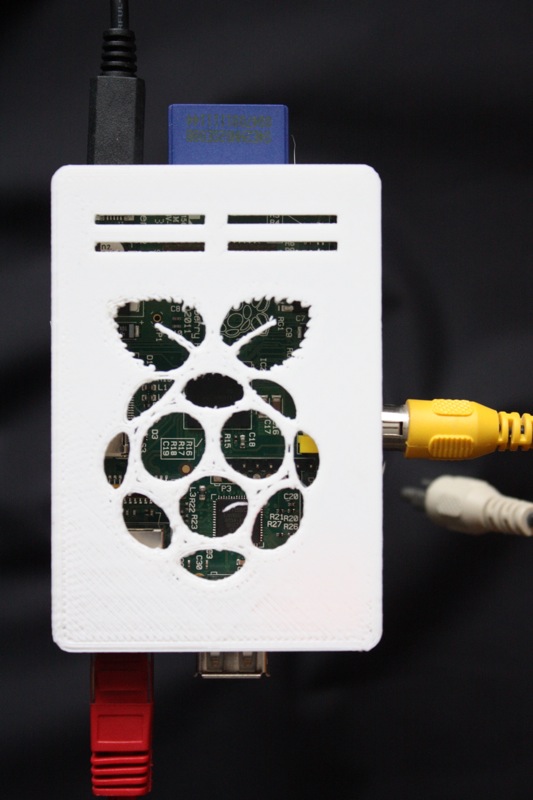
A Raspberry Pi in its printed case
A Raspberry Pi in its freshly printed case
Raspberry Pi in its printed case

After months of anticipation my Raspberry Pi (RasPi) arrived last week. So I spent a little bit of time putting it through its paces. After waiting for the last couple of months I had a short list of things I wanted to test immediately:

Operating System

First order of business was to boot up and try out the various distributions currently offered. On first boot I was a little disappointed to find the RasPi had a few issues with my SD card. When booting the Debian distribution I saw lots of errors when booting. The errors were “mmc0: Too large timeout requested for CMD38!” which I believe are to do with the time the card takes to erase blocks. The card was one I bought very cheaply at a market when I was on holiday in Italy a few years ago so I wasn’t that surprised to see it fail. When I switched to a newer card it behaved normally and the errors disappeared. The SD card images are available from the Raspbery Pi downloads page via bit-torrent.

Debian “Squeeze”

This is the recommended install and comes with an X-Windows GUI using a fast, light-weight desktop environment (called LXDE). The image booted into the standard text mode login prompt. After logging in I started the GUI by typing startx. I was a little surprised to find the ssh server not running by default but that was easily fixed. As I don’t have any HD TVs around, the composite video output works fine but its not ideal to do command-line work. By starting up ssh I’m able to login and develop on the RasPi using my laptop or other computer.

To start the ssh server for the current session you can type the following into the command prompt via a USB keyboard:

sudo service ssh start

To ensure this service is started every time the RasPi is powered up type the following:

sudo update-rc.d -f ssh defaults 20

I also installed a couple of utilities for later testing out the RasPi:

sudo apt-get install screen 
sudo apt-get install minicom

Other than the ssh daemon not being run at boot and having to login and manually start the GUI this distribution behaved as I expected. It’s standard Debian and behaves as such, being able to apt-get anything I tried from the repositories without problems.

Arch Linux ARM

I’ve not worked with this distribution before so didn’t do much more than boot up and see what was installed. As expected this booted into text mode as there is no GUI installed at all. As ssh was running and the Ethernet interface was working out of the box I was able to log in remotely and poke about without any problems.

This is a very basic install, without even another user other than root. I like this cut down system as it seemed very fast with a low memory (both RAM and SD card) footprint. It looks like it will be a good starting point for an embedded server project. Having no experience with the pacman package management system I didn’t investigate very much at all, but think I think I will have another look at this distribution in the near future.

QtonPi

The QtonPi image was the largest of the three images to download, but that is because as well as an image for the SD card it also contains the cross-compilers needed to develop for embedded Qt on ARM via your standard x86 Linux machine. In addition to the compilers and Qt libraries it also contains tools for making new SD card images.

This image is based on Fedora 14 and booted into the console as with the previous two images. This distribution also didn’t have an ssh server running by default. To get ssh working on I needed to bring up the ethernet interface by typing:

ifup eth0

After getting this sorted I was able to ssh into the RasPi. To ensure this happens every boot I edited the file /etc/sysconfic/network-scripts/ifcfg-eth0, changing the ONBOOT option to YES:

ONBOOT=YES

I also changed my timezone by doing the following:

mv  /etc/locatime  /etc/locatime.original
ln -sf /usr/share/zoneinfo/Europe/London /etc/locatime

This is helpful when looking through logs or trying to figure out what files you just changed.

Like the Arch Linux image previously mentioned this distribution also had no X-Windows GUI installed. This image is designed to use the Qt libraries to draw direct to the framebuffer. This is great for embedded systems as you don't have the overhead of a full X-Windows installation.

After following the QtonPi "getting started" instructions from here I could not get the Qt5 "Hello World" example to do any more than produce a white screen. Poking about the system I found some examples already on the card. Some of these "segfaulted" when run while others appeared to have the framebuffer off-centre and while displaying a little text, would not operate as intended.

The workflow for this project seems very nice and well thought through. Developing on the host and then automatically running on the target seemed very slick from within the QtCreator IDE. I look forward to working with it as the Qt5 platform matures.

NOTE: the QtonPi wiki pages seem to be moving about so here is a link to the Google cache version of instructions I followed.

An Enclosure

The second order of business now that I had an operating system was to get a case printed. I chose v12 of "thing" 16104 with the large Raspberry Pi themed ventilation holes. It printed okay but it took a couple of attempts with slic3r to get it to slice the thin walls correctly.

I also needed to move a couple of the connectors to make things fit nicely. I did this the old fashioned way with a file and knife but altering the OpenSCAD model looks pretty straight forward, so I'll probably do that before I print more cases for other people.

USB Serial Drivers

Third on my hit list was to check the drivers are present to talk to my RepRap 3D printer and other serial bits and pieces I have lying about. Both prolific USB to serial (PL2303) and FTDI seem to work fine. I didn't test the devices thoroughly, I simply noted that the drivers was installed and new /dev/ttyUSBx device was created when I plugged them in. I'll probably look at using the GPIO to control my RepRap and other electronics directly but for the immediate future, serial comms to an Arduino will do just fine.

General Purpose I/O (GPIO)

Last on my list was GPIO. I would like to use the RasPi as a real-time controller in embedded systems so I am quite curious to see if I can do anything useful with the GPIO. Later I plan to use it to drive the RepRap directly so I can repurpose my Linux machine in the workshop to do greater things without interrupting the printing process.

While using the information from http://elinux.org/Rpi_Low-level_peripherals I wasn't able to get anything to happen on the GPIO but as this was a late night investigation I'll assume there was something simple I overlooked.

USB Microscope

I have just purchased a Veho USB microscope and am quite pleased with the result. I was hoping to use this as a very cheap replacement for a good binocular microscope. When soldering very fine pitch surface mount devices for prototype or repair a good binocular scope is fantastic for soldering under.

Below is a video test of me upgrading the ATtiny261 to ATtiny861 on my MLMC controller PCB. While the system is reasonably good for soldering it is excellent for inspecting finished the finished work.

Microscope Video Test at 22x magnification

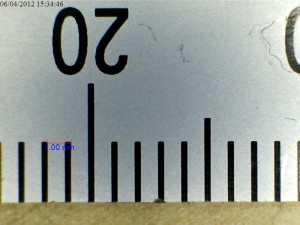
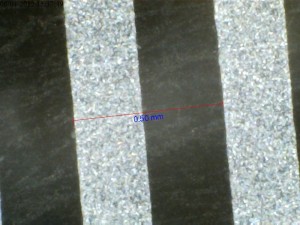
I took a couple of test pictures using the windows software (Microcapture). These are shown below. The software lets you draw in measurements based on the magnification which is entered manually. It’s not the greatest but it is nice and functional.

Microscope Photo Test at 22x magnification

This shows the mm scale on my steel ruler.

Microscope Test at 400x Magnification
Microscope Photo Test at 400x Magnification

This shows the 0.5mm scale elsewhere on the same ruler.

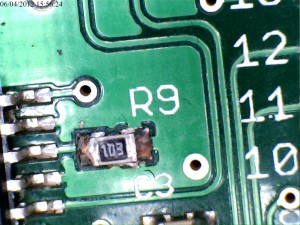
High Resolution Photo Test at 20x magnification

I have tested the device on Windows XP, MacOS 10.7, Fedora15. On linux I had a few issues that later turned out to be a faulty USB hub. In playing around to get the scope to work on Linux I discovered the great GTK+ UVC Viewer program. As all three operating systems have “USB Video Class” drivers everything worked out of the box (hub issues aside).

If Linux does give you any grief you may need to do a modprobe uvcvideo. I didn’t need to do this as I have another webcam plugged in as well that uses the same driver.

I’m not sure what tricks the windows driver uses to get the higher resolution as these modes did not seem to work on other platforms. If anyone knows how to get the high resolution modes working on Linux I would love to hear from you.

Modular LED Matrix Controller version 1.0

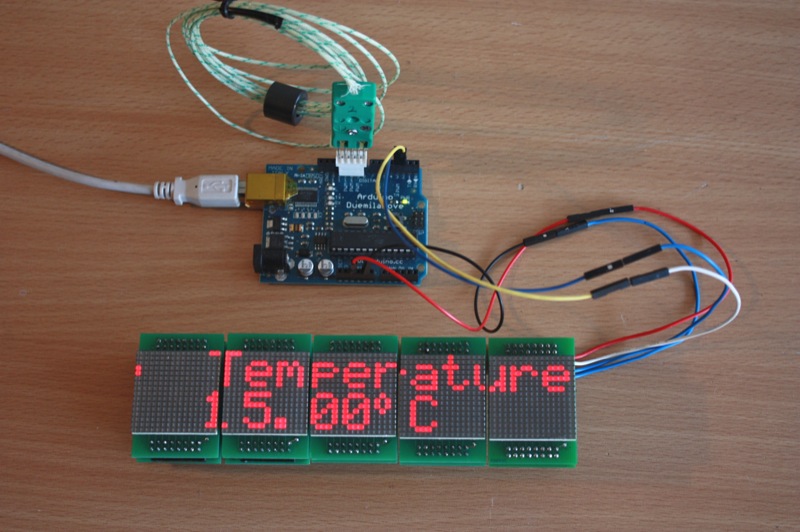
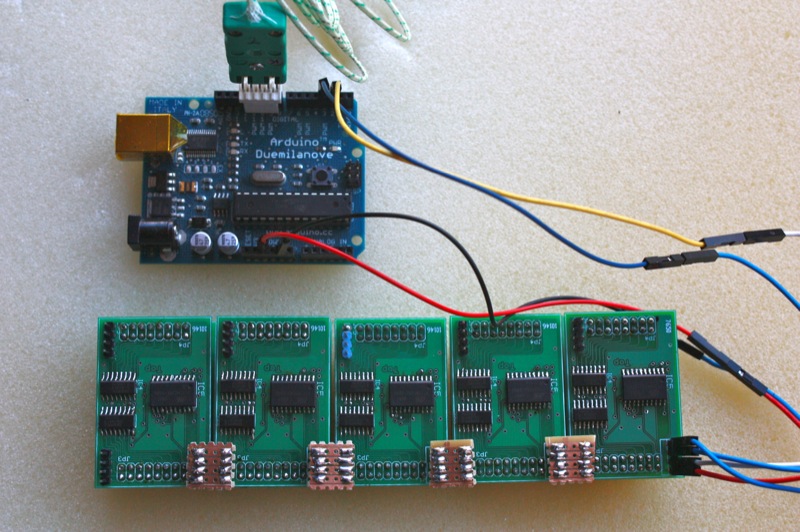
 An Arduino driving 5 MLMC modules displaying the current temperature
An Arduino driving five MLMC modules displaying the current temperature

I have finally motivated myself to publish my firmware and PCB designs for the MLMC on github. The design is functional and I have a set of five modules chained together sitting on my workbench. They happily display the current temperature via an Arduino and the MAX6675 based Thermocouple board I designed previously.

All the files for the project are currently published on github at https://github.com/brokentoaster/MLMC.

Bottom view of the controller PCBs.

This Modular LED Matrix Controller (MLMC) all started about 3 years ago and you can find all the info and a demonstration video at the project web page.

Once a couple of initial glitches in the system had been worked out the modules turned out to be both reliable and easy to drive.

The power consumption as on average 12mA per module while displaying scrolling text. The current consumption is reasonably nicely distributed about the average without any large peaks in current. Each module’s refresh rate is slightly out of sync with its neighbour due to the differences in each of the AVRs on-board oscillators. This has the side effect that all columns switch on at a slightly time and avoids causing a large spike in the current. While not deliberately designed to act this way it is a benefit of the multiple controller modular design.

Trying to drive 1280 LEDs from just 4 wires was not without its problems, the three main problems are covered in greater detail in later posts but in brief they were as follows:

  • Synchronisation issues caused by jitter, noise and missing bits
  • Clocking out the last word from one module to the next
  • PCB design error – SPI pins are not always the same as the ISP serial programming pins.
  • Component Choice. Not enough memory for desired bit depth or bandwidth to achieve original functionality
  • USI in SPI mode is not the same as hardware SPI

Dynamic Logging Examples

As I mentioned in an earlier post, the Butterfly Logger now has a dynamic logging feature. This post elaborates on the benefits and costs of the feature using some data gathered during testing. Some examples of the output while using the feature is shown below in figures 1 and 2. In processing the output from the logger I created a couple of scripts to analyse the data and create graphs. These are included below as listings 1 and 2. While the new feature allows us to log for longer without the risk of missing events, it also costs us in no longer being able to predict how long a logger can be deployed for in the field.

A Graphical Overview

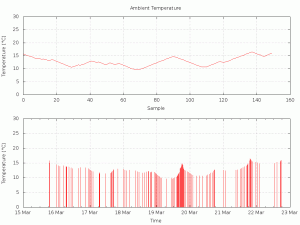
Figure 1: Dynamic logging example.

The two part graph shown above in figure 1 demonstrates the increasing and decreasing of logging frequency as the monitored signal changes more or less quickly. The signal being monitored in this example is the ambient temperature of my garage over a week in March 2011. This was done using the AVR Butterfly’s onboard thermistor.

The upper part of the graph shows the temperature plotted in order sampled as it is stored in the memory of the logger. The lower part of the graph plots the temperature against time. This is done using the date and time as recorded by the logger and using the following lines in gnuplot:

set xdata time
set timefmt "%Y/%m/%d %H:%M:%S"
plot 'dataFile.log' using 1:8 with impulses notitle

The temperature in the lower section is plotted as impulses simply to highlight the change in logging frequency.

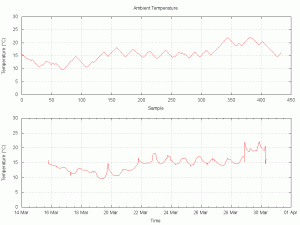
Figure 2: Comparison of data plotted against time or sample index.

The above graph in figure 2 shows a much larger sample from the same logging session. In this plot you can again see the differences between the samples recorded in memory and the samples plotted against time.

You will notice how the samples actually recorded only ever differ by a fixed amount. This is evident through the constant slope of the upper section of the graph. This constant slope, either increasing or decreasing, is an artefact of the logging threshold value. The threshold value is set at compile time in the software.

The software also has a timeout parameter that establishes the maximum logging interval. If no timeout is set the system will only log when the threshold has been exceeded, however if the parameter has been set then the logger will record a sample after a fixed period time (even if the sample threshold has not been exceeded).

The minimum interval is specified by the sample period parameter as used when logging in the standard mode. The timeout value is simply specified as a multiple of this interval.

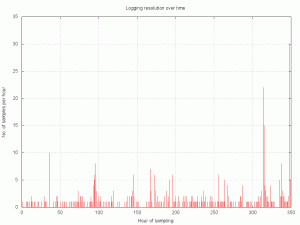
Figure 3: Dynamic resolution of the data expressed as number of samples per hour.

Figure 3 is yet further analysis on the same data from the previous two graphs. This plot shows the logging resolution over time. The resolution is expressed as the number of samples recorded per hour. This figure was calculated by processing the data and counting the number of samples recorded that hour. Where no data is recorded for a given hour a zero is recorded. A Perl script to produce this data from the logger output is shown below in listing 2.

This example gives us a good metric for measuring the effectiveness of dynamic logging. If you examine the graph you can see that, at its peak rate, the logger is recording at a resolution of 30 samples per hour. The logging interval for this session was set to once per second, giving us a maximum sample rate of 3600 samples per hour. As the rate is dynamic it makes sense to also look at the average rate over the whole period, which is just over 2 samples per hour. If we compare the average rate to the peak rate we can gauge the efficiency introduced by the dynamic logging feature.

TABLE 1: Numerical summary
Number of hours monitored: 168
Number of samples recorded: 350
Minimum sample rate: none
Maximum sample rate: 3600 samples per hour
Average sample rate: 2.1 samples per hour
Samples needed if using peak rate: 5040
Samples needed if using maximum rate: 604,000

Conclusions

The benefits of dynamic logging

By looking at the number of samples needed at the peak sample rate and comparing this to the number of samples used, we can calculate the theoretical saving in redundant samples. If we were to capture the same data using standard methods we would have used over 14 times more samples. As our storage space is limited, if we were using a standard technique we could only log for a much shorter time.

This reduction in space used can be taken advantage of in two ways. If the temperature characteristics in the garage remain unchanged the logger could record for 3 years without filling up the flash. This is much much more than possible using the standard technique. Another way to utilise this extra space would be to log more sensors over the same period as possible with standard logging.

Other than storage savings the major benefit of the dynamic sample rate is that dramatic events are not missed. If we had wanted to conserve storage space using standard methods we would risk the possibility of sudden changes in the data being overlooked by a much slower sample rate.
Using a dynamic rate we get the benefits of a higher sample rate without the storage cost.

The costs of dynamic logging

There are a couple of disadvantages to this dynamic sample rate technique. One of these is the reduction in resolution in our sensors. This is due to the threshold introduced before a sample is taken. The resolution of the ADC has effectively been reduced from 1024 to approximately 340 levels. For our example this reduces the temperature to a resolution of 0.1°C per level in the temperature range we are looking at. (< Due to the non-linear nature of the thermistor, the effective temperature resolution will change of over the range of the sensor >)

The logger will also consume more power due to being out of sleep mode more often. The logger needs to leave sleep mode often to check if it should be recording a sample to flash. Compared to just reading of the sensorsWriting to flash is by far the most power hungry activity of the logger when c, because of this I don’t anticipate the extra power requirements to be too great, although I have not actually measured the impact.

When using a fixed sample rate technique you can calculate the exact length of time a logger will be able to log for prior to deployment. With the dynamic sample rate you can no longer know how long you can log for when deploying a logger. To mitigate this issue you could either make a prediction based on prior knowledge or develop a method to alert the user when the memory is approaching capacity.

Using data previously gathered in an environment you can predict how long it is reasonably likely to log for. Using the example data used I would calculate the expected logging capacity based on 700 samples a week (< Doubling the average sample rate we saw in the data simply for reasons of contingency. >). Using this value would allow logging for something like 80 weeks or so. This is of course still 7 times longer than standard logging would allow. These types of calculations could potentially be incorporated to the firmware to make using dynamic logging more useful.

Scripts

As promised above I have included the scripts used to produce the data and graphs. They might be useful to anyone getting started with using Gnuplot, BASH and Perl to automate graphing and analysis.

#!/bin/sh

# script to plot logging results temperature against time.
# also plot temperature samples for comparison and analysis of
# the dynamic logging system.

#assume arg 1 is name of file with ^M's ^D's and non data lines already removed.

maxtemp=30

# look at number of points per hour
#cut -d\  -f2 ${1} | cut -d: -f1 | uniq -c > ${1}_res

# TODO: need to pad out hours with zero points
# DONE: use pad.pl to calculate number of samples per hour and pad any zeros
# 	Does not check for an entire day with out samples though.
cat ${1} | ./pad.pl > ${1}_res

gnuplot << EOF
set terminal png size 1024,768 enhanced font "/Library/Fonts/Microsoft/Arial,12"
set output "$1_resolution.png"
set origin 0,0
set grid
set yrange [0:35]
set title 'Logging resolution over time'
set ylabel 'No. of samples per hour'
set xlabel 'Hour of sampling' 
plot '${1}_res' u 2 w i  not

set output "${1}_comparison.png"
set multiplot
set origin 0,0.5
set size 1,0.5
set xdata 
set yrange [0:${maxtemp}]
set title 'Ambient Temperature'
set xlabel 'Sample'
set ylabel 'Temperature (°C)'
plot '$1' u 8 w l not

set origin 0,0
set size 1.0,0.5
set xdata time
set timefmt "%Y/%m/%d %H:%M:%S"
set ylabel 'Temperature (°C)'
set yrange [0:${maxtemp}]
set xlabel 'Time'
set title ''
set format x "%d %b"
plot '$1' u 1:8 w l not

set output "${1}_impules.png"
set multiplot
set origin 0,0.5
set size 1,0.5
set xdata 
set yrange [0:${maxtemp}]
set title '150 Samples of Ambient Temperature'
set xlabel 'Sample'
set ylabel 'Temperature (°C)'
plot '< head -150 $1' u 8 w l not

set origin 0,0
set size 1.0,0.5
set xdata time
set timefmt "%Y/%m/%d %H:%M:%S"
set ylabel 'Temperature (°C)'
set yrange [0:${maxtemp}]
set xlabel 'Time'
set title ''
set format x "%d %b"
plot '< head -150 $1' u 1:8 w i not
EOF

open $1_resolution.png
open $1_comparison.png
open $1_impules.png

Listing 1: BASH script to process the data into graphs.

#!/usr/bin/perl -w

use strict;
# simple script to process temperature logs and show number of samples per hour

# my old script did this...
## look at number of points per hour
##  cut -d\  -f2 ${1} | cut -d: -f1 | uniq -c > ${1}_res
# .. but that didn't account for hours with no samples at all.

# my variables...
my @lines;
my $line;
my $hour;
my $previous_hour;
my $first = 1;
my $count = 0;
my @fields;
my @time;

# read in all lines from stdin
chomp(@lines = <STDIN>); 

#process each line in turn
foreach $line (@lines) {
		
		# extract the hour value from the time, ignoring the date.
		@fields = split /\s+/,$line;
		@time = split /:/,$fields[1];
		$hour = $time[0];
		
		# set up the previous_hour for the first line to enable the count
		if ($first == 1){
			$previous_hour = $hour;
			$first = 0;
		}
		
		if ($hour == $previous_hour){
			#increment the count of samples for this hour 
			$count++;

		} else{
			#  print our total and move on to the next hour
			print "$previous_hour \t $count \n";
			$count = 0;
			$previous_hour++;
			$previous_hour %= 24;
			
			# check for non consecutive hours and pad out with zero totals
			# assuming their hasn't been a total day without samples
			while ($previous_hour != $hour){
				print "$previous_hour \t $count \n";	
				$previous_hour++;
				$previous_hour %= 24;
			}
			
			# remember to count this first new sample in our totals 
			$count=1;
		}	
}

# done

Listing 2: PERL script to process the data logger output and calculate the number of samples per hour.

Butterfly Logger Firmware 0.31A

I’ve just completed another release of firmware for the AVR Butterfly Logger project. It can be download it at the project site on Sourceforge.

New Features

The main feature of this update is dynamic logging. I’ll post some examples of this in action soon but for now I’ll just give you a basic overview.

Dynamic logging means that the period between samples is altered dynamically at runtime depending on the state of the system being monitored. If the system is undergoing rapid change then many samples will be taken automatically. If the system is stable then very few samples will be taken at that time. This has the same effect as sampling continuously at a high sample rate but removing any repeated or redundant data except that the repeated and redundant data is simply never recorded.

When using the dynamic logging feature you will need to log time and date to enable you to be able to properly reconstruct the data later once downloaded.

The dynamic logging feature also has an optional timeout value so that if no change has been read from the ADC for a large number of log attempts then a log is forced to ensure a minimum resolution such as 1 sample every hour is maintained.

Currently the dynamic logging feature only monitors a single ADC channel. I have plans to extend it to monitor other sensors and also multiple sensors simultaneously in future releases.

Setup and options for the dynamic logging features are currently maintained in the file main.h. There are some comments in the file to explain the options available.

To save on program space the dynamic logging parameters can be implemented as a compile time option. If more flexibility is wanted the features can also be implemented with the parameters as runtime changeable options that can be altered via the serial port interface.

Bug Fixes

This version also includes a fix for an issue with updating the LCD readings after the flash was full.

KiCad OS X nightly development builds are back

After about eight months of not running I have fixed my nightly builds of KiCad for OS X. I have finally found the time to switch my KiCad repository over to the Bazaar and launchpad system that the KiCad developers have been using for some time now.

After a few changes here and there and updating wxWidgets to 2.9.1 I have the nightly build system back up and running. The build script I am using is given at the end of this post in Listing 4.

The KiCad compiling instructions for OS X have been updated and now work a lot better. You should be able to find the latest version over at launchpad here.

In case anyone else runs into similar problems I have repeated some of the errors and my hacks/work-arounds solutions below.

The nightly builds themselves are here as usual.

Getting it to compile again.

After following the compilation instructions referred to above, I ran into the following error. After a bit of web crawling and reading development lists I found that I needed to use the XML library built into wxWidgets rather than the system one.

The error looked like this:

Linking CXX executable eeschema.app/Contents/MacOS/eeschema
Undefined symbols:
“_XML_GetErrorCode”, referenced from:
wxXmlDocument::Load(wxInputStream&, wxString const&, int)in libwx_osx_cocoau-2.9.a(monolib_xml.o)
“_XML_ErrorString”, referenced from:
wxXmlDocument::Load(wxInputStream&, wxString const&, int)in libwx_osx_cocoau-2.9.a(monolib_xml.o)
“_XML_SetUnknownEncodingHandler”, referenced from:
wxXmlDocument::Load(wxInputStream&, wxString const&, int)in libwx_osx_cocoau-2.9.a(monolib_xml.o)
“_XML_SetCharacterDataHandler”, referenced from:
wxXmlDocument::Load(wxInputStream&, wxString const&, int)in libwx_osx_cocoau-2.9.a(monolib_xml.o)
“_XML_SetUserData”, referenced from:
wxXmlDocument::Load(wxInputStream&, wxString const&, int)in libwx_osx_cocoau-2.9.a(monolib_xml.o)
“_XML_ParserFree”, referenced from:
wxXmlDocument::Load(wxInputStream&, wxString const&, int)in libwx_osx_cocoau-2.9.a(monolib_xml.o)
“_XML_SetCdataSectionHandler”, referenced from:
wxXmlDocument::Load(wxInputStream&, wxString const&, int)in libwx_osx_cocoau-2.9.a(monolib_xml.o)
“_XML_SetCommentHandler”, referenced from:
wxXmlDocument::Load(wxInputStream&, wxString const&, int)in libwx_osx_cocoau-2.9.a(monolib_xml.o)
“_XML_Parse”, referenced from:
wxXmlDocument::Load(wxInputStream&, wxString const&, int)in libwx_osx_cocoau-2.9.a(monolib_xml.o)
“_XML_SetElementHandler”, referenced from:
wxXmlDocument::Load(wxInputStream&, wxString const&, int)in libwx_osx_cocoau-2.9.a(monolib_xml.o)
“_XML_ParserCreate”, referenced from:
wxXmlDocument::Load(wxInputStream&, wxString const&, int)in libwx_osx_cocoau-2.9.a(monolib_xml.o)
“_XML_GetCurrentLineNumber”, referenced from:
_StartCdataHnd in libwx_osx_cocoau-2.9.a(monolib_xml.o)
_CommentHnd in libwx_osx_cocoau-2.9.a(monolib_xml.o)
_TextHnd in libwx_osx_cocoau-2.9.a(monolib_xml.o)
_StartElementHnd in libwx_osx_cocoau-2.9.a(monolib_xml.o)
wxXmlDocument::Load(wxInputStream&, wxString const&, int)in libwx_osx_cocoau-2.9.a(monolib_xml.o)
“_XML_SetDefaultHandler”, referenced from:
wxXmlDocument::Load(wxInputStream&, wxString const&, int)in libwx_osx_cocoau-2.9.a(monolib_xml.o)
ld: symbol(s) not found
collect2: ld returned 1 exit status
make[2]: *** [eeschema/eeschema.app/Contents/MacOS/eeschema] Error 1
make[1]: *** [eeschema/CMakeFiles/eeschema.dir/all] Error 2
make: *** [all] Error 2

Error 1: Missing XML library

This was fixed by adding the --with-expat=builtin option when configuring wxWidgets.

This then lead me to another error to do with wxWidgets headers using anonymous enums and anonymous types. Part of this second error is shown below.

/opt/wxwidgets-svn/include/wx-2.9/wx/combo.h: In member function ‘bool wxComboPopup::IsCreated() const’:
/opt/wxwidgets-svn/include/wx-2.9/wx/combo.h:774: error: ‘‘ is/uses anonymous type
/opt/wxwidgets-svn/include/wx-2.9/wx/combo.h:774: error: trying to instantiate ‘template struct boost::polygon::is_polygon_90_set_type’
/opt/wxwidgets-svn/include/wx-2.9/wx/combo.h:774: error: ‘‘ is/uses anonymous type
/opt/wxwidgets-svn/include/wx-2.9/wx/combo.h:774: error: trying to instantiate ‘template struct boost::polygon::is_polygon_45_or_90_set_type’
/opt/wxwidgets-svn/include/wx-2.9/wx/combo.h:774: error: ‘‘ is/uses anonymous type
/opt/wxwidgets-svn/include/wx-2.9/wx/combo.h:774: error: trying to instantiate ‘template struct boost::polygon::is_any_polygon_set_type’
make[2]: *** [gerbview/CMakeFiles/gerbview.dir/class_gerber_draw_item.cpp.o] Error 1
make[1]: *** [gerbview/CMakeFiles/gerbview.dir/all] Error 2
make: *** [all] Error 2

Error 2: Anonymous enums using anonymous types being marked as errors by the compiler

Rather than figure out which flag to set on the cmake/compiler/linker mess, I went for a brute-force approach that I found here after a small amount of searching. I have expanded from the script given to the ones below to account for the particular style used in the wxWidgets header files.

for i in `grep -l ‘enum {‘ *.h | sed -e ‘s/\.h//g’` ; \
do \
perl -pi -e \
“s/enum {/’enum en_$i’ . int(rand(100)) .’ {‘/eg” $i.h; \
done

Listing 1: Small script to replace all occurances of “enum {” with “enum en_filenameXX {“

Listing 1 is the original script given which enumerates the anonymous enums with a name consisting of the filename (without the extension) and a random number from 0-99.

This next command I adapted from the first to account for the fact that the style of the wxWidgets header files meant that a lot of the enums were declared with the keyword enum alone on a line with the rest of the declaration on the following line. This finds those declarations and assigns them a name similar to the first script but with a number from 100-199 to ensure we don’t repeat names already given. It is shown below in Listing 2.

for i in `grep -l ‘^enum en_.*$’ *.h | sed -e ‘s/\.h//g’` ;\
do \
perl -pi -e \
“s/^enum$/’enum en_$i’ . int(rand(100)+100) .”/eg” $i.h;\
done

Listing 2: Small script to replace all occurrences of “enum” with “enum en_filename1XX ” where “enum” occurs by itself on a line and assuming the rest of the declaration continues on the following line.

The problem with the previous two scripts is that they use a random number to assign the unique identifier. Being random there is the possibility that this number can come up twice.
This last command (Listing 3) helps us check for duplicate names generated by the previous scripts. We then need to go in and fix the duplicates by hand.

grep ‘enum en’ *.h | sort | uniq -c | sort -n

Listing 3: Command to check for duplicate names created by previous two scripts.

A single script could be written to give unique identifiers to all the anonymous enums and ensure that the identifiers are unique. But as this was a quick enough process and solved my problems I haven’t bothered to refine it further. Perhaps next time I update wxWidgets I’ll give it another thought. I thought this was a useful enough hack to share.

Automating the builds

Listing 4 below shows my daily build script which automatically updates the code to the latest development snapshot via Bazaar. Next it will check if the version has changed and if so build and package the latest version. If this all goes well we compress the new version into an archive and upload it to the website. If the compilation does not complete according to plan then the error log and some other useful information is uploaded to the website instead. Note that all usernames and passwords have been changed to placeholders in this version. This is run every day (or night depending on your time zone) by a cron job.

#!/bin/sh
#
. /Users/nick/.bashrc

#Make a nightly build of KiCad

#update from launchpad using bazaar
cd /Temp/kicad.bzr/kicad/
bzr update

new_version=`bzr revno`
old_version=`cat /temp/install/version.txt`
if [ $new_version -gt $old_version ]
then

#build it
cd build/release

cmake ../../ -DwxWidgets_CONFIG_EXECUTABLE=”/usr/local/bin/wx-config” -DwxWidgets_ROOT_DIR=”/opt/wxwidgets-svn/include/wx-2.9/” -DCMAKE_INSTALL_PREFIX=”/temp/install” -DCMAKE_OSX_ARCHITECTURES=”ppc -arch i386 -arch x86_64 -isysroot /Developer/SDKs/MacOSX10.5.sdk/ -mmacosx-version-min=10.5″ -DCMAKE_CXX_FLAGS=”-D__ASSERTMACROS__” -DCMAKE_OSX_SYSROOT=”/Developer/SDKs/MacOSX10.5.sdk”

# make clean
if make > /temp/kicad_errors-${new_version}.txt 2>> /temp/kicad_errors-${new_version}.txt && make install
then
file=kicad_osx_v${new_version}
echo $new_version > /temp/install/version.txt
mv /temp/kicad_errors-${new_version}.txt /temp/install/build_log.txt

#bundle
cd /temp/
cp -rf install ${file}
tar -czf ${file}.tgz ${file}

#upload
curl -T ${file}.tgz ftp://user:password@ftp.brokentoaster.com/
rm -rf ${file}

# cd /temp/kicad-sources/build/release/
# /Developer/usr/bin/packagemaker –doc osx-package.pmdoc –title ‘Kicad’ -o ${file}.mpkg
# curl -T ${file}.mpkg ftp://user:password@ftp.brokentoaster.com/

else

#insert some useful debug info
echo “*** GCC Version Info ***”>> /temp/kicad_errors-${new_version}.txt
gcc -v >> /temp/kicad_errors-${new_version}.txt

echo “*** wxWdgets Version Info ***”>> /temp/kicad_errors-${new_version}.txt
wx-config –list >> /temp/kicad_errors-${new_version}.txt
head /Volumes/Store/wxWidgets-2.9.1/osxbuild/config.log >> /temp/kicad_errors-${new_version}.txt

curl -T /temp/kicad_errors-${new_version}.txt ftp://user:password@ftp.brokentoaster.com/
fi

# go to sleep
if [ ! -e /Users/nick/Applications/insomnia.flag.true ]
then
open /Users/nick/Applications/SleepNow.app
fi
else
echo “KiCad is up to date : ) ”
fi

Listing 4: BASH script to update, build and upload KiCad. This is run daily via a cron job

So if you want to test the latest developer build of KiCad on OS X then look no further than here.

Butterfly Logger Firmware 0.30C (bugfix)

Last week I released another firmware update for the AVR Butterfly Logger. This was a bugfix to the thermistor routines for calculating negative temperatures from the onboard temperature sensor.

You can download the source code from SourceForge.

The thermistor routines in the logger project were adapted from Martin Thomas’ port of the Atmel AVR Butterfly example code. This routine compares the ADC input from the thermistor sensor to a table of known readings. The table () contains a single entry for each degree celsius from -15°C to +60°C. The routine would simply step through the table until the ADC reading exceeded ( negative temperature coefficient (NTC) device. This means as the temperature increases the resistance drops. In our electrical configuration of the sensor this also applies to the voltage seen at the ADC input.>) the value in the table. The position in the table is then given as the temperature in degrees celsius.

When first developing the data logger in 2004 and 2005 I quickly wrote an interpolation routine that would extend the integer value given in the original with an extra two decimal places. After finishing writing the code I reviewed both the code and the corresponding output. At the time of that brief review everything appeared to make sense. As the original project had other more accurate temperature sensors available, the operation of the onboard temperature sensor was not critical. The onboard temperature sensor was instead intended as a fast secondary sensor for live feedback to the user via the LCD and so the code was not widely tested. Whoops.

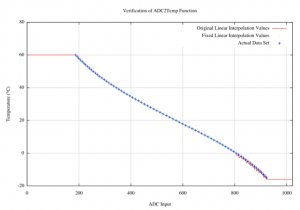
This December (being the coldest on record in the UK for the last 100 years) showed up some of the flaws in my code. After some prompting from a couple of users of the project I set aside some time to investigate further. My investigation involved writing a test routine to simulate all possible sensor readings and then evaluating the results. This was an incredibly simple exercise, just a few lines of code and then plotting the results with Gnuplot. The output from the function is shown below in Figure 1.

Figure 1: Thermistor routines test output

This figure shows the full-scale results for the original and fixed routines along with the data points given in the original source. As you can see the interpolated line appears to follow the datapoints quite nicely until it drops below zero degrees.

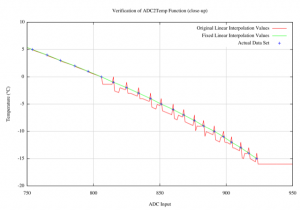
At this point the linear interpolation is way-off and producing mostly garbage (you can see this clearly in the close-up below in Figure 2)

Figure 2: Close-up of the thermistor routines test output

Looking at the close-up in Figure 2 you can see the awful job the routine does when dealing with negative temperatures. If you look very closely at the positive temperatures you will also note a small error in that calculation as well. After plotting the output and going over the code it was very easy to spot the couple of errors. After the corrections the graph of the output (The green line in Figures 1 and 2) intersects perfectly with the data points given in the source code. If it were not for visual inspection of the results (via the graph) I don’t think I would have noticed this second error at all.

Further changes were also made to the routine so that when the readings are outside the range specified by the data table then they will record an over or under temperature error. This is signified in the log as +++.++ or ---.-- for over temperature or under temperature respectively. On the LCD, +++.+C or ---.-C is displayed. Previously the routine had just returned the maximum or minimum temperature from the table.

It had been at the back of my mind that there was something not quite right about that bit of code for some time. It was so simple in the end to write a routine to test the function with all possible inputs that I could kick myself for not doing it earlier. By plotting the results on a graph it became obvious how the code was misbehaving. The key lessons I’ve learned from this it is that a little testing goes a long way and that some simple visualisation can really help you understand a bug quickly.

More information about the AVR Butterfly Logger project can be found at the project website.

Any questions can be asked in the project forums.

Rigol 1102E: First Impressions

I recently decided to treat myself and get an oscilloscope. After much consideration I decided to go with an entry level Rigol. I liked the large number of positive reviews I was reading for these scopes all over the net (two examples here and here). After patiently waiting, unpacking and having a good play I can honestly say I’m impressed.


19200 baud asynchronous serial, first 6 bits with close up on start-bit edge.

Figure 1: A sample of the bitmap output from the Rigol 1102E

Figure 1 above shows serial communications on my Reprap Mendel. This has been my test signal as I put the scope through its paces while I try to locate the source of intermittent serial communications problems. Having bitmap output makes blogging about electronics a whole lot easier.

After having a few weeks play I have to say I’m a fan of the interface. I was pleasantly surprised by the center push feature on all the dials. A center push on the vertical position will center the trace about the zero point and a center push on the horizontal will center the trace about the trigger point. These are very nice interface enhancements that feel very natural and intuitive to use.

The performance of the scope is great although I have not pushed it anywhere near the limits.

To give you a better idea of what I am comparing this to I’ve compiled a list scopes I’ve used in the passed. These are scopes I’ve used in the workplace, spending countless days interacting with.

  • Tektronics 475 200Mhz – A fantastic old analogue storage scope
  • Tektronics TDS 320 100Mhz – A nice digital storage scope (not LCD though), with the printer, GPIB and serial communication cards.
  • Tektronics TDS 1002 60Mhz – An entry level, modern LCD scope but no printing or serial communication.
  • Tektronics TDS 3000 series – DPO very nice colour LCD scope with floppy drive for saving waveforms to.

This is the first scope I’ve used which I’ve actually forked out the cash for so I am very happy with my purchase and find it compares very favourably to those I’ve used in the past. This scope has more features than I’ve ever had before. The datasheet for the DS1000E Series is here.

  • I like the modern features (USB host, USB remote, Colour LCD, FFT, Pass Fail, 1M samples, etc)
  • I like the legacy features (RS232 port on the back)
  • I like the specs (100MHz, 1GS/s)
  • I like the warranty (3 years parts and labour)
  • I REALLY Like the price. This scope cost me £420 including VAT, delivered to my door.

I’d like to post a more complete review sometime, but I think there are already plenty of people saying the same as what I’m saying — A fantastic scope, unbeatable for the price.